Here's your crash course on the Bayesian vs Frequentist debate in the statistics community.
OVERVIEW OF THE BAYESIAN VS. FREQUENTIST DEBATE
There is a philosophical debate that has divided the statistics community. For decades, the discipline has been split by two schools of thought that couldn’t be more diametrically opposed to one another.
In our first camp we have the Frequentists. The Frequentists are the larger group by far; most statistical analysis you would encounter “out in the wild” would fall within this category, and nearly all statistics courses required in general education undergraduate programs follow this school of thought.
Broadly speaking, Frequentist statistics is a type of statistical inference that involves drawing conclusions from data samples by measuring the frequency or proportion of a given quantity within the data. Within the field of Digital Analytics, Frequentist techniques are widely used in A/B testing to ascertain the performance of a test variation (B) versus the control (A).
On the other side of the aisle, we have the Bayesians. Bayesians regard probabilities as degrees of belief. Likewise, they argue that the best way to estimate probabilities is to create a mathematical representation of the deterministic forces that underpin all outcomes to an event; this is far easier said than done, however. For this reason, the Bayesian paradigm has always been a bit of a “dark horse” among statisticians. Bayesian statisticians are harder to come by than Frequentists, and until recently were almost exclusively university professors and academics, rather than industry-level professionals.
Bayesian inference is an approach to statistics based on Bayes’ Theorem, where existing knowledge is integrated into a statistical model at the beginning of an experiment and continually updated as more information emerges as more data is collected. Due to their high computational complexity, most Bayesian methods were essentially theoretical - hypothetically accurate, but not useful due to severe technological limitations. However, the rapid development of computational power has enabled Bayesian statistical methods to become more mainstream, with several industry leaders now forgoing Frequentist methods in favor of Bayesian methods.
WHAT ARE FREQUENTIST STATISTICS?
Frequentist statistics, or Frequentist inference, views probability as the limit of the frequency of event occurrences across many repeated trials. This approach is based on the underlying belief that a perfectly true probability exists for any given event and that it can be extrapolated by measuring its long-term frequency.
However, it isn’t feasible to accurately calculate these “perfectly true probabilities,” as doing so would require infinitely-many repeated trials, or a dataset of infinite length. Instead, conclusions are drawn from what data is available, and p-values are incorporated as a sort of proxy to determine whether or not a significant difference exists between two discrete data samples.
With the Frequentist approach, you start with the hypothesis that no differences exist between two variations (i.e., the control and test groups). At the end of the experiment, you end with a probability value (p-value). The p-value is the probability of the observed results occurring by random chance; in other words, the likelihood that significant differences exist between the two data samples. The lower the p-value, the less likely it is that any differences in the data were caused by random chance.
TL;DR for CMOs: Frequentist stats are the methods you, more likely than not, learned in your freshman level Intro to Statistics course. Think p-values, confidence intervals, z-scores, chi-squared, etc. It’s fundamentally all about drawing comparisons between two or more datasets and determining if significant differences exist between them.
WHAT ARE BAYESIAN STATISTICS?
Bayesian statistics involve encoding past knowledge of similar experiments into a type of statistical device, known as a prior distribution. These prior distributions can be subjective and can reflect the researcher's knowledge and expertise about the problem at hand, but this also means that the calculation setup is limited by the researcher’s perspective. The Bayesian approach then uses Bayes' theorem to update these prior distributions as more data is accumulated, resulting in a posterior distribution that summarizes the current state of knowledge and draws conclusions on the test hypothesis.
Bayes’ Formula serves as the bedrock for Bayesian methodology. It is as follows:
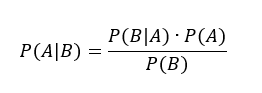
- P(A|B) is our “posterior probability,” generally equivalent to the statement “probability of event A given event B occurred”
- P(B|A) is the probability of observing event B given event A, also called the “likelihood”
- P(A) is the “prior probability,” the information we have on the hypothesis before any data is considered
- P(B) is the model evidence, the new information derived from the data
Bayesian methods lend themselves well to multistep A/B tests. For instance, you could run two A/B tests at different points of the checkout flow on a website: one on a product detail page and one in the shopping cart. In order to assess the quality of the treatment experience in the cart, you could ask yourself, “what’s the likelihood of a user checking out if they were shown the control experience on the product detail page?” In this example, the prior is that the user was shown the control experience on the product detail page; this is crucial information that would be difficult to take into consideration using the Frequentist approach.
TL;DR for CMOs: Bayesian statistics aims at answering the question, “what is the likelihood of event A happening given that event B just occurred?” In this case, event B has some degree of influence over event A, and by incorporating our knowledge of that relationship into our statistical calculations we can ideally craft a more accurate prediction of event A. In practice, any number of priors would be taken into account, but for the sake of this example let’s just assume there’s only one.
DIFFERENCES BETWEEN BAYESIAN AND FREQUENTIST STATISTICS
The most fundamental difference between each of the methods is how they approach statistical problems from the outset, or more specifically, how each method views parameters.
A parameter is any number that describes an attribute of a whole population; think of any descriptive measure, like mean, median, mode, etc. Parameters and statistics are often confused with one another, as they are very similar. The difference lies within their scopes. Statistics pertain to discrete sample sizes, while parameters relate to entire populations.
For example, the standard deviation of weights of all avocados grown in the state of California would be a parameter, while the standard deviation of weights of all avocados sampled from a single farm in California would be a statistic. It’s virtually impossible to directly measure parameters since the datasets they correspond to are so large, so the goal of statistics is to draw broader conclusions from sample datasets that (hopefully) capture whatever trends exist in the population.
Frequentists insist that parameters are not random variables, and instead argue they are fixed, unvarying quantities that lack probability distributions. These quantities are generally unknown, so Frequentists calculate confidence intervals to estimate them. The idea is that parameters can be calculated by measuring the frequency or proportion of something in the data sample, even if the underlying factors that determine these values are unknown.
On the other hand, Bayesians assert the exact opposite. They contend that population parameters are random variables and can be represented by probability distributions. The term ‘random variable’ is actually quite misleading, as they are neither random nor variables. Random variables are actually functions meant to map out a set of finite outcomes to a given problem or provide a range of possible solutions. The probability distribution for a population parameter is meant to express our prior knowledge; to incorporate existing information into a problem before adding additional information that comes from a data sample. The goal then becomes estimating the values of unobserved parameters with a range of probabilities, called a “credible interval” (not to be confused with confidence intervals).
Here’s a relatively simple, though perhaps oversimplified, way to convey the difference between Frequentist and Bayesian statistics.
Take a coin flip, if you asked a Frequentist what the probability of it being heads is, they would say something along the lines of, “There’s no probability involved with this. The coin is either heads or tails, its status is fixed. If it’s heads, then the probability of heads is 100%. If it’s tails, then the probability of heads is 0%.”
The deterministic forces behind the coin flip don’t actually matter to a Frequentist, they only care about repeated observations. Imagine the coin is flipped 10 times and lands on heads for 7 of those flips. According to a Frequentist, the probability of landing on heads is approximately 70%. Intuitively, we know this isn’t true but from a Frequentist’s point of view this is a logical conclusion. Realistically, this result would never be accepted since the sample size is so small, but I’m just trying to illustrate how Frequentist methods work.
| TRIAL |
1 |
2 |
3 |
4 |
5 |
6 |
7 |
8 |
9 |
10 |
… |
∞ |
| RESULT |
H |
T |
T |
H |
H |
T |
H |
H |
H |
H |
— |
— |
| OBSERVED PROBABILITY |
100% |
50% |
~33% |
50% |
60% |
50% |
~57% |
~63% |
~67% |
70% |
— |
50% |
Referring to the table above, as the number of coin flips tends off to infinity, the frequency of heads and tails will both approach 50% because, as we know, both outcomes are equally likely. And this leads us to our result, the probability of landing on heads is 50%.
Bayesians would answer the question with, “Well, I know there are only 2 sides to the coin (prior), so the probability must be 50%. But that’s only my limited perspective. Whoever can see the coin would answer differently…”
Before even flipping the coin or looking at the data, a Bayesian would likely recall two things. First there are only two outcomes from flipping a coin since coins only have two sides. Second, there’s no reason to believe that either outcome is any more likely to occur than the other. Given these two pieces of information, it makes sense to conclude that the probability of landing on heads is 50%.
Ultimately both methods arrive at the same destination, though they each take very different paths. Neither is perfect either. The Frequentist method is counterintuitive, and the Bayesian method is highly susceptible to bias. One leans too heavily into the data while the other doesn’t enough.
TL;DR for CMOs: They’re very different, trust me.
GENERAL TRADE OFFS IN STATISTICAL MODELS FOR A/B TESTING
In this section we’ll explore the strengths of each statistical method. Given their opposing nature with one another, the strength of one paradigm is, more often than not, a weakness of the other.
Strengths of Bayesian Statistics:
FLEXIBILITY: Bayesian statistics allows for the incorporation of prior knowledge and the use of different prior distributions, making it suitable for handling complex and sometimes subjective problems. Bayesian methods are especially useful for multi-step probability questions. There are also certain situations where it’s obviously useful to incorporate prior information.
MODEL SELECTION: Bayesian model selection provides a natural way to compare different models and determine the most appropriate one for a given problem. To contrast, Frequentist methods are comparatively rigid, and do not provide a natural way to compare different models or determine the most appropriate one for a given problem.
INTERPRETABILITY: Bayesian posterior distributions directly provide the degree of belief in a hypothesis, making it easier to understand and communicate results. This is crucial for analysts making recommendations to stakeholders. In most cases, clients only seek an educated business recommendation, not absolute statistical certainty.
TIME: One of the benefits of Bayesian methods is that they allow researchers to redevelop their hypotheses over the course of a single experiment as new information emerges. In contrast, “peeking” at the data before the end of an experiment is forbidden under the Frequentist paradigm. Bayesians are free to “call the winner” of an experiment as soon as it is clear, instead of having to wait until the end of a set trial period, which can last for months.
INTUITIVE RESULTS: Bayesian methods allow researchers to say with confidence that there’s a X% chance of the hypothesis being true. Frequentist hypothesis tests do not allow for this, as they do not provide a direct measure of the degree of belief in a hypothesis. Studies suggest that most people (~80%) misunderstand Frequentist statistics, often misinterpreting the results as Bayesian probabilities. For this reason, it would arguably be better to provide Bayesian probabilities as they’re generally more understandable and what casual audiences naturally assume confidence intervals to be.
Strengths of Frequentist Statistics:
OBJECTIVE RESULTS / NO SUBJECTIVE PRECONDITIONS: Frequentist statistics is based on objective probability and avoids subjective choices in the modeling process. With the Bayesian method, you lose the ability to present answers as objective fact. Concepts such as statistical significance and rejecting a null hypothesis don’t exist in the Bayesian world; there’s only “event X is more likely or less likely” etc. Furthermore, the results of Bayesian analyses are dependent on the choice of prior distributions, which can be subjective or poorly defined. Sometimes priors are inherently qualitative, which can unfortunately diminish the validity and consistency of the experiment results.
SIMPLICITY: Frequentist statistics is based on well-established mathematical theory and can be easier to implement and computationally less intensive. Frequentist methods are much more standard compared to Bayesian methods, requiring significantly less strategizing and preparation. For testing teams operating on tight budgets, it often makes the most sense financially to pick the quickest, most procedural method. In most cases, Frequentist and Bayesian methods would arrive at the same answers anyway.
NOT COMPUTATIONALLY TAXING: Most statistics libraries you can download for Python and R are based on Frequentist methods. Because Frequentist methods are very “countable” in their nature, they lend themselves well to programming. Calculating Bayesian posterior distributions can be computationally intensive, especially for complex models, or straight up intractable in extreme cases. Bayesian models continually take more priors into account as new, helpful information is uncovered. This means that the runtime complexity of the model increases with each subsequent iteration. However, this has become less of an issue as computers have gotten more powerful, though it’s still something to consider.
PERFECT FOR A/B TESTING: Frequentist methods generally work exceptionally well for comparing two data samples against each other, so it makes a lot of sense for A/B Testing.
SO WHICH STATISTICAL APPROACH IS BETTER?
It really depends on the situation. Neither paradigm is inherently better than the other. In many ways, they each exist to counter the pitfalls of the other. I know this feels like a cop out, but this is a longstanding debate for a reason.
That being said, I would recommend using Frequentist methods as a default in a business context. Compared to Bayesian methods, they’re very procedural since they’re based upon well-established mathematics. Frequentists lean into the “one size fits all” approach more than the Bayesians. I would then use Bayesian methods on a case-by-case basis, leveraging them in situations where their strengths would shine through.
In situations where several objective, quantifiable priors are clear and available, Bayesian statistics might be the better choice. However, if the priors are nebulous and subjective, Frequentist would be better. Identifying priors can be a time-consuming process too. For a business, extra time spent identifying the preconditions of an experiment is money lost.
In most cases though, the difference between the two doesn’t matter, as they should generate similar results. Mathematical certainty isn't the goal; making better educated business decisions is. When it comes to testing, there are many cases where the results strongly favor one outcome in order to optimize the performance of a KPI, but only weakly support the outcome as being mathematically and empirically factual. Essentially this argument comes down to solving the same problems in two different ways.
Fully utilizing the capabilities of Bayesian and Frequentist statistics is not unlike playing jazz music, as both require a degree of ingenuity and improvisation. It wouldn’t be right to declare either philosophy as universally superior to the other. No two hypotheses are the same, and as such may warrant the use of different kinds of “statistical jazz.”
About the Author: Samuel Pratt is a Data Analyst on Evolytics | A Concord Company's Experimentation & Strategy team specializing in A/B Test Development, Customer Journey Analytics and Implementation Best Practices. He is Adobe Analytics and Google Analytics certified and has worked across a wide variety of clients including Vail Resorts, Kroger Co., and Intuit.
