
With so many data visualization tools available on the market, how do you choose the right one? This guide offers an in-depth comparison of Tableau and Qlik Sense to help you select the best solution for your organization.
In the realm of data visualization and analytics, choosing the right tool is pivotal for organizations aiming to harness the full potential of their data. Qlik Sense and Tableau are significant players in this field, offering solutions for creating impactful visualizations and driving data-informed decision making.
In this blog series, we will provide a practical and straightforward comparison of Qlik Sense and Tableau. We’ll explore how each tool handles data, visualizes data, their unique user interfaces and use cases, and finally, provide more advanced details on managing an organization’s data using each tool.
Preparing Your Data
Many business intelligence tools include some form of data preparation tool, with some being integrated into the tool itself while others exist as standalone programs. The first step toward data analysis in Qlik Sense and Tableau involves ingesting and transforming data. Qlik Sense integrates its data preparation within the Data Load Editor, whereas Tableau offers a standalone program known as Tableau Prep.
When first building a new app, Qlik Sense users primarily interact with their data through a section of the program called the Data Load Editor. Here, users not only ingest their data but perform data cleaning and transformation. The Data Load Editor also gives users access to manage data connections, write their own load scripts, and load the data into the app. Qlik Sense also features a Data Model Viewer and Data Manager that both allow for further control over the data presented in the app.
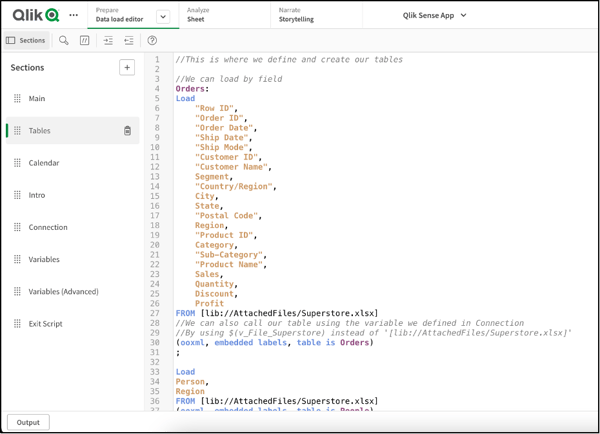
Users load and transform data in the Qlik Sense Data Load Editor.
Tableau Prep is a no-code data preparation tool developed by Tableau, designed to assist users in connecting and loading data from multiple sources. Users can then apply various transformations, such as filtering, pivoting, aggregations, and joins/unions, consolidating them into a single source. By leveraging this prep tool, users can efficiently prepare their data for analysis in Tableau Desktop, saving time and effort in the ETL process of their projects.
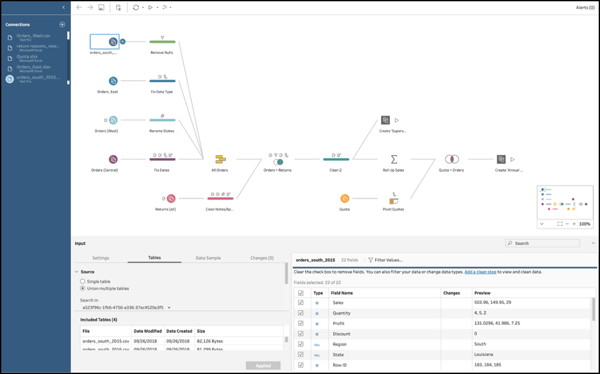
Tableau Prep
Custom SQL
One of the most common languages used to query data is SQL, and both Qlik Sense and Tableau offer robust methods for analysts to utilize it. This is an area where the tools are very similar, with a few notable exceptions.
In Qlik Sense, users can utilize custom SQL and other languages in the Data Load Editor using functions that set the script language. This allows users to query large databases stored outside of Qlik or query attached files. Users can transform their data through joins, aggregations, and filters, as well as create new or altered tables. Qlik Sense is unique in that it also utilizes its own language, unofficially known as “Qlik Script.” By combining the functions of SQL and Qlik Script, users can transform massive amounts of data into custom-tailored solutions for their analysis.
Similarly, Custom SQL in Tableau enables the user to write and execute SQL queries directly from within the program to retrieve custom datasets tailored to your specific requirements from your data source. This feature allows users to include complex joins, filtering, and aggregation, which provides flexibility and control over the data sourcing process. However, it is crucial to write efficient queries, especially when dealing with live connections to the data source, to avoid impacting the performance of the workbook.
Data Connections
When choosing a data visualization tool, users may face limitations based on the location of their data and whether the tool has access to that database, website, or file type. Qlik Sense and Tableau both support various data connections and file types, ranging from cloud-hosted databases to local CSV files.
The Qlik Sense Data Load Editor offers several data connection types, including ODBC connections like Databricks or Amazon Athena, web and social connectors such as Jira and Facebook Insights, REST API, Salesforce, and various file types as attached files. Multiple data connections and file types can be utilized within a single app, allowing users to connect disparate data and better understand the full story behind their analytics.
Similarly, Tableau offers versatile data connection capabilities, allowing users to connect to a wide range of data sources, including files (Excel, CSV), databases (MySQL, SQL Server), cloud platforms (Google Analytics, Salesforce, AWS), data warehouses, and other big data platforms.
Relationships in Your Data
When working with large datasets from multiple sources, users must consider how to create relationships within their data. Qlik Sense and Tableau each handle this task in unique ways, making them more suitable for certain use cases than others.
Qlik Sense users can manually join using left/inner/etc joins, concatenate/no concatenate functions, or allow Qlik’s data model to associate data through the use of synthetic keys. Synthetic keys link like-data between datasets through a key created from a shared field, typically a date, ID, or similar field with distinct values within the table. A single unified dataset can contain multiple synthetic keys. This relationship links data in ways that can uncover hidden insights and relationships that an analyst might otherwise overlook.
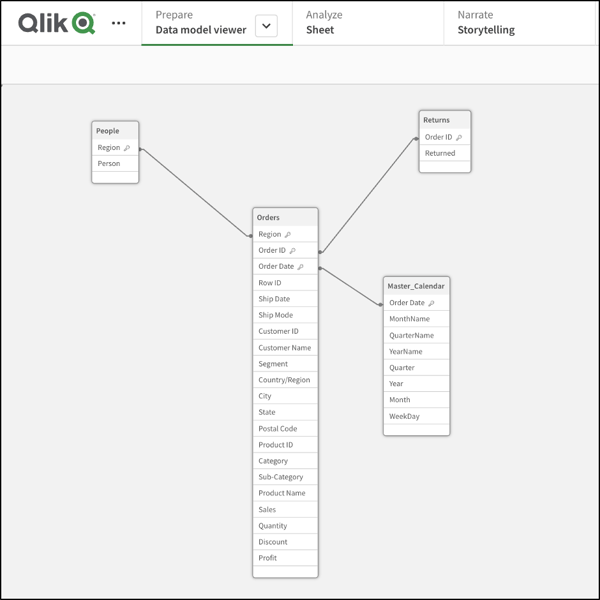
The Qlik Sense data model view allows users to visualize table joins and relationships.
Within the Tableau data source section, users can connect to various data repositories such as databases, files, and spreadsheets. Once connected, users can prepare their data by joining multiple data sources based on common fields or keys, which then provides different types of joins and supports data blending to combine data from multiple sources. Relationships, on the other hand, are logical connections between tables in Tableau’s data model. This allows users to define how tables are related based on common fields, keeping tables separate and enabling more flexible querying and filtering of the data without physically combining it through table joins.
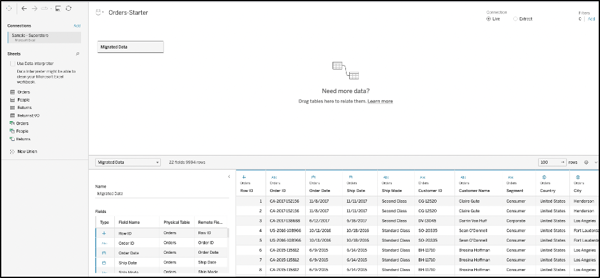
Tableau data source view.
Managing Large Data Sets
Another factor to consider when choosing a visualization tool is the size of the data you'll handle. Tableau and Qlik Sense have distinct approaches to managing large datasets: QlikView Data Files and Extracts.
Qlik Sense users can store data in files known as QlikView Data (QVD) files. These files are generated during data loading and can contain substantial amounts of data in a single file, which can then be selected, transformed, and loaded into an app. The use of QVD files significantly reduces app load times, as loading data from a QVD is up to 100 times faster compared to reading from other data sources. By initially storing the data in a QVD file, users can subsequently load and transform their data without having to re-query the data connection or reload the data.
Tableau extracts are a snapshot of data stored locally in Tableau’s proprietary data format (TDE or Hyper), which allows users to work with large datasets more through data compression. Extracts are a great way to improve performance and flexibility when working with large datasets in Tableau, as they offer faster query processing, offline access, and enhanced data manipulation capabilities. However, extracts may become outdated if not regularly refreshed, leading to potential storage overheads, especially if the large extract consumes significant local disk space. Despite this, extracts alleviate the burden on data sources and facilitate efficient analysis within Tableau.
Keeping Data Up-To-Date
Another factor to consider when choosing between the two tools is how they handle data refreshes, guaranteeing that your analysis always utilizes the most current data.
In Qlik, setting up refreshes is accomplished through the Qlik Management Console (QMC). Apps can have multiple tasks scheduled on time-based triggers (daily, hourly, monthly, etc.) or event-based triggers (on app reload complete or failure, for instance). Users can set up a string of event-based triggers to refresh QVD files and load them into a final dashboard for regular analysis. The QMC also allows users to edit these tasks, set up email or Slack alerts for failures, and monitor the size of applications on the server.
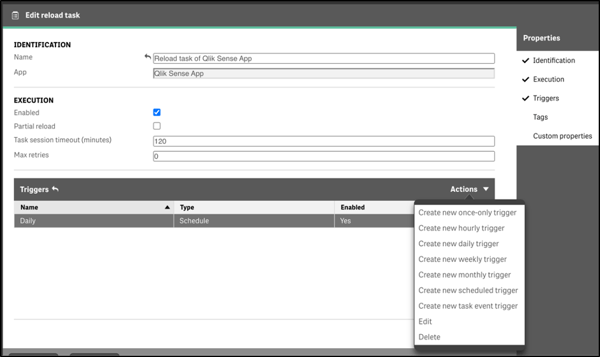
The Qlik Sense Management Console is where users can manage apps, including setting up scheduled refreshes or event triggers
Tableau Server and Tableau Online allow users to schedule automated refreshes at specific intervals (daily, weekly, monthly, etc). Administrators can set up refresh schedules for extracts or data sources, ensuring that the data remains current without manual intervention. Tableau Online provides two methods for data refreshes: full or incremental. In a full refresh, Tableau replaces all data within an extract or data source, ensuring data consistency but potentially consuming more resources and time for larger datasets. On the other hand, incremental refreshes retrieve only new or updated data since the last refresh from the original data source, reducing refresh time and resource usage for large datasets. By offering both refresh options, Tableau enables users to balance data accuracy and resource utilization according to their data needs.
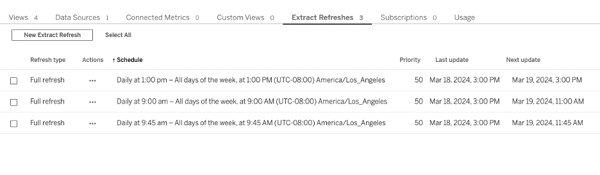
The Tableau Online Server allows you to create multiple scheduled extract refreshes.
File Types and Collaboration
Finally, once your data is ingested, organized, and ready for use, each tool allows for exporting a file containing the data (and any visualizations created with it). These files enable users to share their data and analysis with coworkers and clients, and to manage version control as the datasets develop and become more complex.
Users can export their Qlik Sense app containing data as a Qlik View File (QVF). Similar to a Tableau workbook, this format allows users to share apps or upload to different environments, such as a staging or production environment, to manage testing and user access. Qlik Sense also allows users to export apps without the data attached, keeping only the visualizations, data load script, and any permissions or settings. This can be useful for various reasons but is particularly helpful in cases where a smaller file or faster upload is needed.
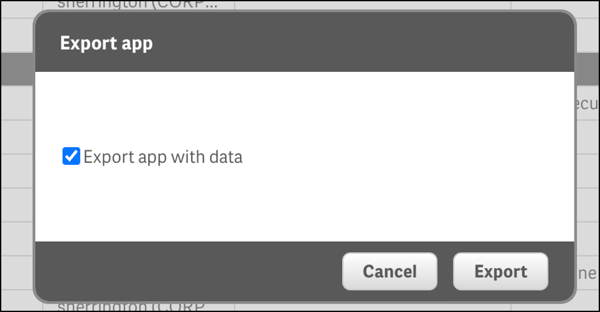
When users export a Qlik Sense app, they can choose to export it with or without data. The resulting QVF file can then be shared across users and environments.
A Tableau Packaged Workbook (TWBX) is a file format used by Tableau to package workbooks along with their associated data sources and extracts. TWBX files are self-contained and portable, making it easy to share and distribute among other Tableau users. The packaged workbook preserves visuals, data connections, and data sources used in the workbook so users can interact with the workbook without needing access to the original data sources.
Looking Forward
We’ve covered the basics of preparing data for use in Qlik Sense and Tableau, as well as the considerations that may impact your decision to choose one tool over another. Both Qlik Sense and Tableau are industry leaders for visualizing and analyzing large datasets using different data connections and ways to load, transform, and manage it.
In the next blog post of this series, we’ll explore the differences in how these two tools visualize data by covering chart types, the user interface, and ways to share your visualizations and analyses.
If you need help evaluating and/or implementing BI tools, Concord is here to help. Contact our experts to learn more about each tool and which is right for your business.
