
Find out how to apply meta-analysis to your experimentation practice to gain better insights from your data.
Experiments, experiments everywhere and no way to summarize them? Struggling to make sense of contradictory hypotheses and test results? Wondering how your experimentation environment has changed year-over year? Augment your testing practice and cut through the noise using meta-analysis.
What is meta-analysis?
Meta-analyses are studies of studies. More precisely, they are the study of an effect across different studies to draw out the “true” measure of its value. There is information that can be pulled when there are multiple studies of something by pooling those studies together using a little bit of fancy math but is difficult to obtain otherwise (for a variety of reasons). Enter meta-analysis, a family of formalized methods for studying multiple effects to get an estimate of a “true” quantity. It has a few requirements:
- More than one study of the variable must be conducted
- The input and outputs are the same quantities, and must be present in all studies
- Ideally, all studies are measured in the same way
Okay, so there’s fancy math. What does that have to do with me?
For a more practical example, we’ll examine a common problem in the marketing realm: I have a few campaigns, but want to get the “true” conversion rate of this type of intervention. In this scenario, I have four campaigns with varying conversion rates. We can pool these together to get the “true” conversion rate by just adding everything up and dividing for the rate:

But that’s not the whole story: unless your campaigns all happen under identical circumstances to identical populations, this won’t really get you very far. Prospects fall out of the pipeline, your business strategy pivots, and the seasons change, or you could just get plain unlucky. So, we compensate! Instead, we assume that each campaign gives us some information about the overall value, but that we can’t trust them to be perfectly representative:
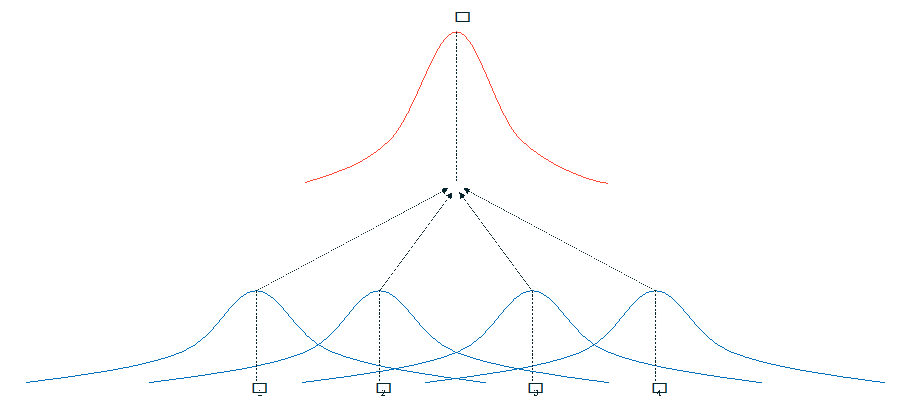
The key assumption here is that there is a hidden (called “latent” in academic circles) distribution that we’re guessing at, with “true” mean (and using to stand for any kind of sample mean). If you’re a statistics person, you’ll recognize this as a very similar idea to the Central Limit Theorem. But where the rubber meets the road is not the estimate of the average effect, but in the variance between the effects. When we do meta-analysis, we can estimate both:
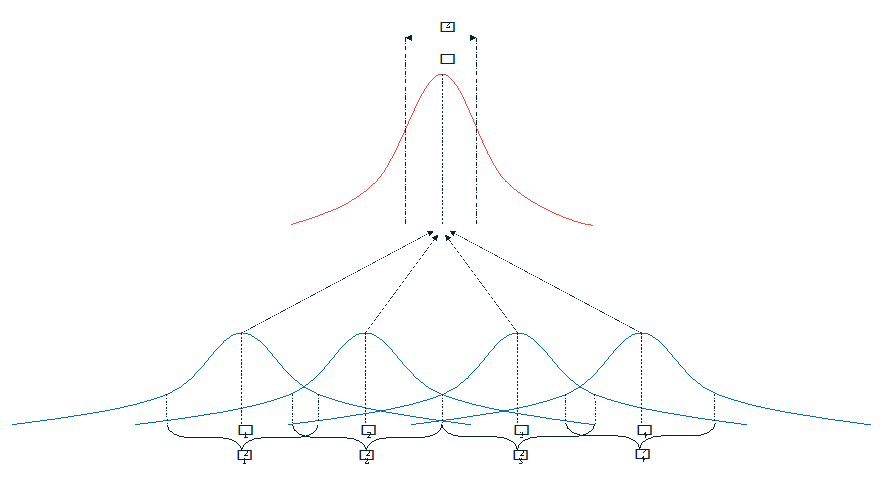
In the picture above, you can see that we’re measuring two types of variance: , or the variance within the sample of the campaign (the kind we’re used to), and , which is the variance between the campaigns. These concepts are analogous to ANOVA, a popular method of analyzing complex experiments, but designed for multiple experiments. More advanced forms of this can test multiple groups of experiments, but these are the basics.
To translate this to your marketing practice, we take a few steps:
- We divide our campaigns into the subgroups we want to compare (e.g. Organic vs. Paid Search)
- We treat each campaign as a test with its own sampling error (AKA a “quasi-experiment”)
- We compute the “true” mean for each subgroup to get its “true” (latent) effect, including confidence (or credible) intervals at a preset level (e.g. 95% confidence/credibility)
- If these intervals do not overlap, we can conclude that there is evidence of a difference. If they do, then we conclude that there is not enough evidence
Should we even invest in testing this?
As an example, let’s say we have a set of six campaigns, half of which are active for our recipients during the morning in their local time, and the other being active for the afternoon (I’ll use “AM” and “PM” for shorthand here). The image below illustrates this problem:
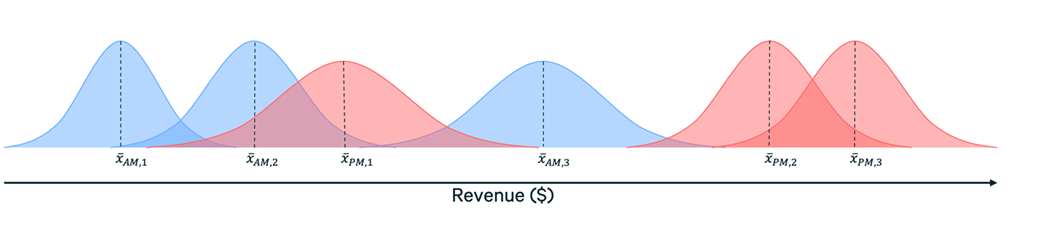
As you can see, the evidence is mixed, but it looks like PM campaigns generate more revenue on average, even if one campaign is lower than the others. We might conclude that we should invest more resources into afternoon campaigns, or at minimum, look for ways to optimize the morning campaigns. If we’re really performing due diligence, we’d make this a candidate for an A/B test.
In setting up a test, we might hypothesize that PM campaigns generate more revenue than AM campaigns, go through the power calculations, and run the test, potentially taking significant time and web traffic.
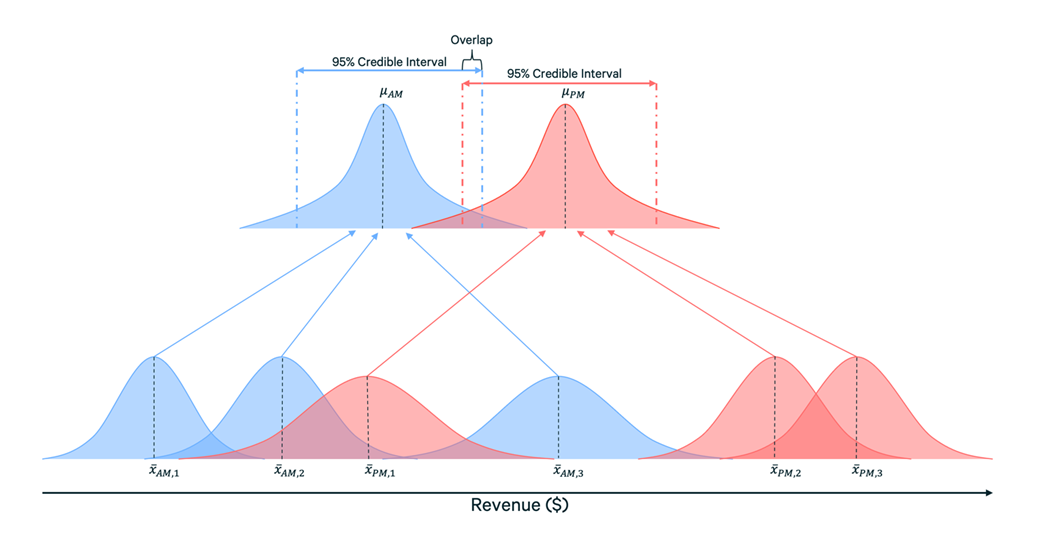
If we conduct a meta-analysis that treats the campaigns as experiments, we get something akin to the picture above. When we compare our credible intervals, they overlap, meaning that there isn’t sufficient evidence in the data to indicate a difference. As a result, it likely doesn’t make sense to invest in a hypothesis test for this question. While it’s worth emphasizing that doesn’t rule out our hypothesis entirely, it certainly makes it less likely.
There are several statistical meta-analysis techniques to examine this, though this example is based on the Bayesian Hierarchical Model technique.
What else can I do with meta-analysis?
There are a few key uses for this technique in your testing and campaign environments:
- Winnow down your hypotheses (shown above): Since you can perform this analysis on subgroups, you can statistically compare two independent groups of campaigns. While a significant (or credible, if you’re a fancy Bayesian) difference in subgroup averages doesn’t prove a hypothesis by itself, a lack of significance (or credibility) can certainly rule them out as a testing candidate, cutting through the noise.
- Build a data-backed hypothesis: Many times, when someone sets up a hypothesis for an A/B test, it isn’t clear why they’ve chosen the threshold (effect size for the test) that they have. You can use to inform this choice, since it gives you a measure of inter-experiment variability. As an example, in addition to your power calculations, you can compare the effect size to to see how far outside the norm the difference would be. If your hypothesized difference is less than one , then it’s possible that you won’t be able to detect the result.
- Gather evidence for hard-to-test hypotheses: Sometimes it’s simply not practical to run a hypothesis test. Insufficient traffic or population, the realistic change is too small, other hypothesis tests taking precedence, high variance in a subgroup, or even the end of a vendor contract may interfere with your ability to run a test. Meta-analysis can be a useful method of garnering a result when an experiment is not available, though we should note that it is subject to the same caveat as any observational analysis.
- Evaluate your testing program: What is the typical impact of a test or campaign? Has that changed year-to-year, or is your underlying data just more noisy? Are there campaign types that are becoming more effective? These questions can be confirmed or ruled out using meta-analysis, and let you steer your program at a high level.
- Confirm a hypothesis across multiple tests: This is the most common reason to utilize this family of techniques. If you’re running a smaller testing program, it’s possible that you’ll see multiple different effect sizes for the same question depending on the test, or a mix of significant and insignificant tests. When you use meta-analysis, you’ll get a refined estimate of your effect size and direction, giving you a stronger estimate when you have mixed results.
When shouldn’t I use meta-analysis?
Meta-analysis isn’t a shortcut or a way around your experimentation practice. Here are a few situations where running it probably won’t be practical, or even counterproductive:
- When you have consistent results: If you have multiple tests that provide similar effect sizes, and the inter-experiment variations aren’t practically interesting to your business, then running a meta-analysis is unlikely reveal any new information.
- To replace hypothesis testing: Meta-analysis is great for clarifying questions raised by a set of varied experiments or campaigns but cannot replace There are always underlying conditions or confounding variables that can interfere with your implementation.
- To “disprove” insignificant experiments: Generally, if you’re failing to find evidence for your hypothesis under testing, meta-analysis will reflect those same effects.
Want to know what type of meta-analysis you should be using for your situation, or just need help with your experimentation practice in general? Contact Concord to learn about our Experimentation, Strategy, Data Science, and Digital Analytics offerings.
